Understanding The Apogee MQ-500 PPFD
Understanding Light
The Apogee MQ-500 PPFD, light meter is perfect for mapping out hot-spots and dull-spots in your grow room. Eliminating dull-spots and filling it with light creates a more uniform canopy and cola development than before.
In order to understand grow lights, we need to understand light, we will break light up into wavelengths, photosynthetic active radiation (PAR), photosynthetic photon flux (PPF) and photosynthetic photon flux density (PPFD).
The wavelength component of light refers to the distance between a waves crests and is measured in manometers (nm). Changes in wavelength between 400-700nm results in the different colours of visible light.
Photosynthetic Active Radiation (PAR)
The measure of photons (µmol) between wavelengths 400-700nm that carry enough energy to drive photosynthesis. PAR measures the sum total of each wavelength of light your grow-light is producing. This reading is a basic way of comparing grow lights emission of photosynthetically active light.
Photosynthetic Photon Flux (PPF)
PPF is the measure of PAR (micromoles) produced per second (μmol/s) by a light. This measure does not however show us how much light is actually reaching our canopy, as there is no distance component.
Photosynthetic Photon Flux Density (PPFD)
The actual amount of PAR that reaches the surface of a leaf each second. This measure must be taken at the desired height above the canopy as the intensity of the light drops with distance. PPFD it is measured in micromoles (PAR) per square meter per second (μmol/m2/s).
Real World Application
Lets compare two hypothetical grow lights (Figure 1), a 600W HPS, and an LED. The HPS produces 1100μmol/s, while one LED module produces 384μmol/s at the cost of 140W. Three LED modules emit 1152μmol/s light with 450W of electrical draw from the mains. Replacing the 600W HPS with three LED’s will save you 35% on your electricity bill and produce a 5% better light.
When considering the PAR value of grow lights and the sun, we recommend aiming for a reading of 900-1500μmol/s; this is within the range of sunlight. Grow lights produce different PPFD readings depending on distance from canopy. Using a light meter to accurately draw up maps of PPFD in your grow room can show you where additional lighting is required. Many grow lights produce a central, high intensity light, directly above a light meter, however as you move further from directly under the light towards the edges, the light levels dip (Figure 1).
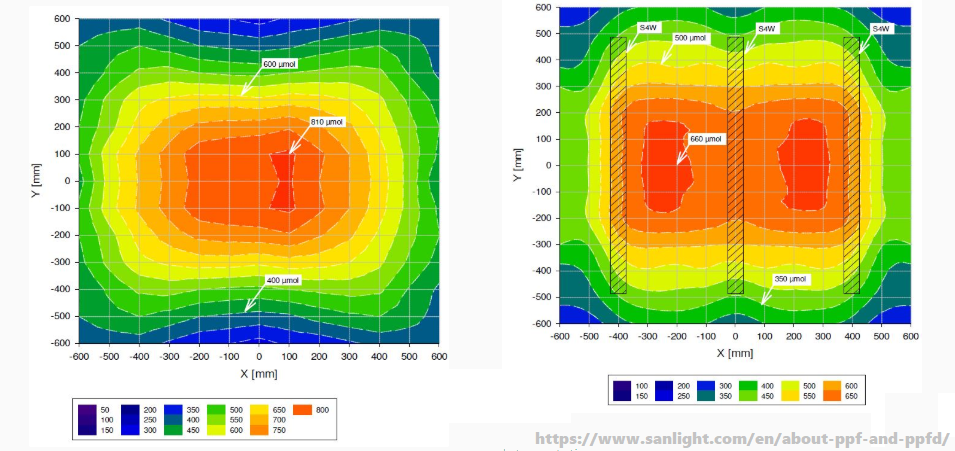
Figure 1) PPFD map reading for 600W HPS from 50cm (Left) and LED module from 30cm (Right).
If you have any additional questions regarding light and cannabis, please comment down below and we can make a video or article regarding those topics.
via IFTTT
Leave a Reply